


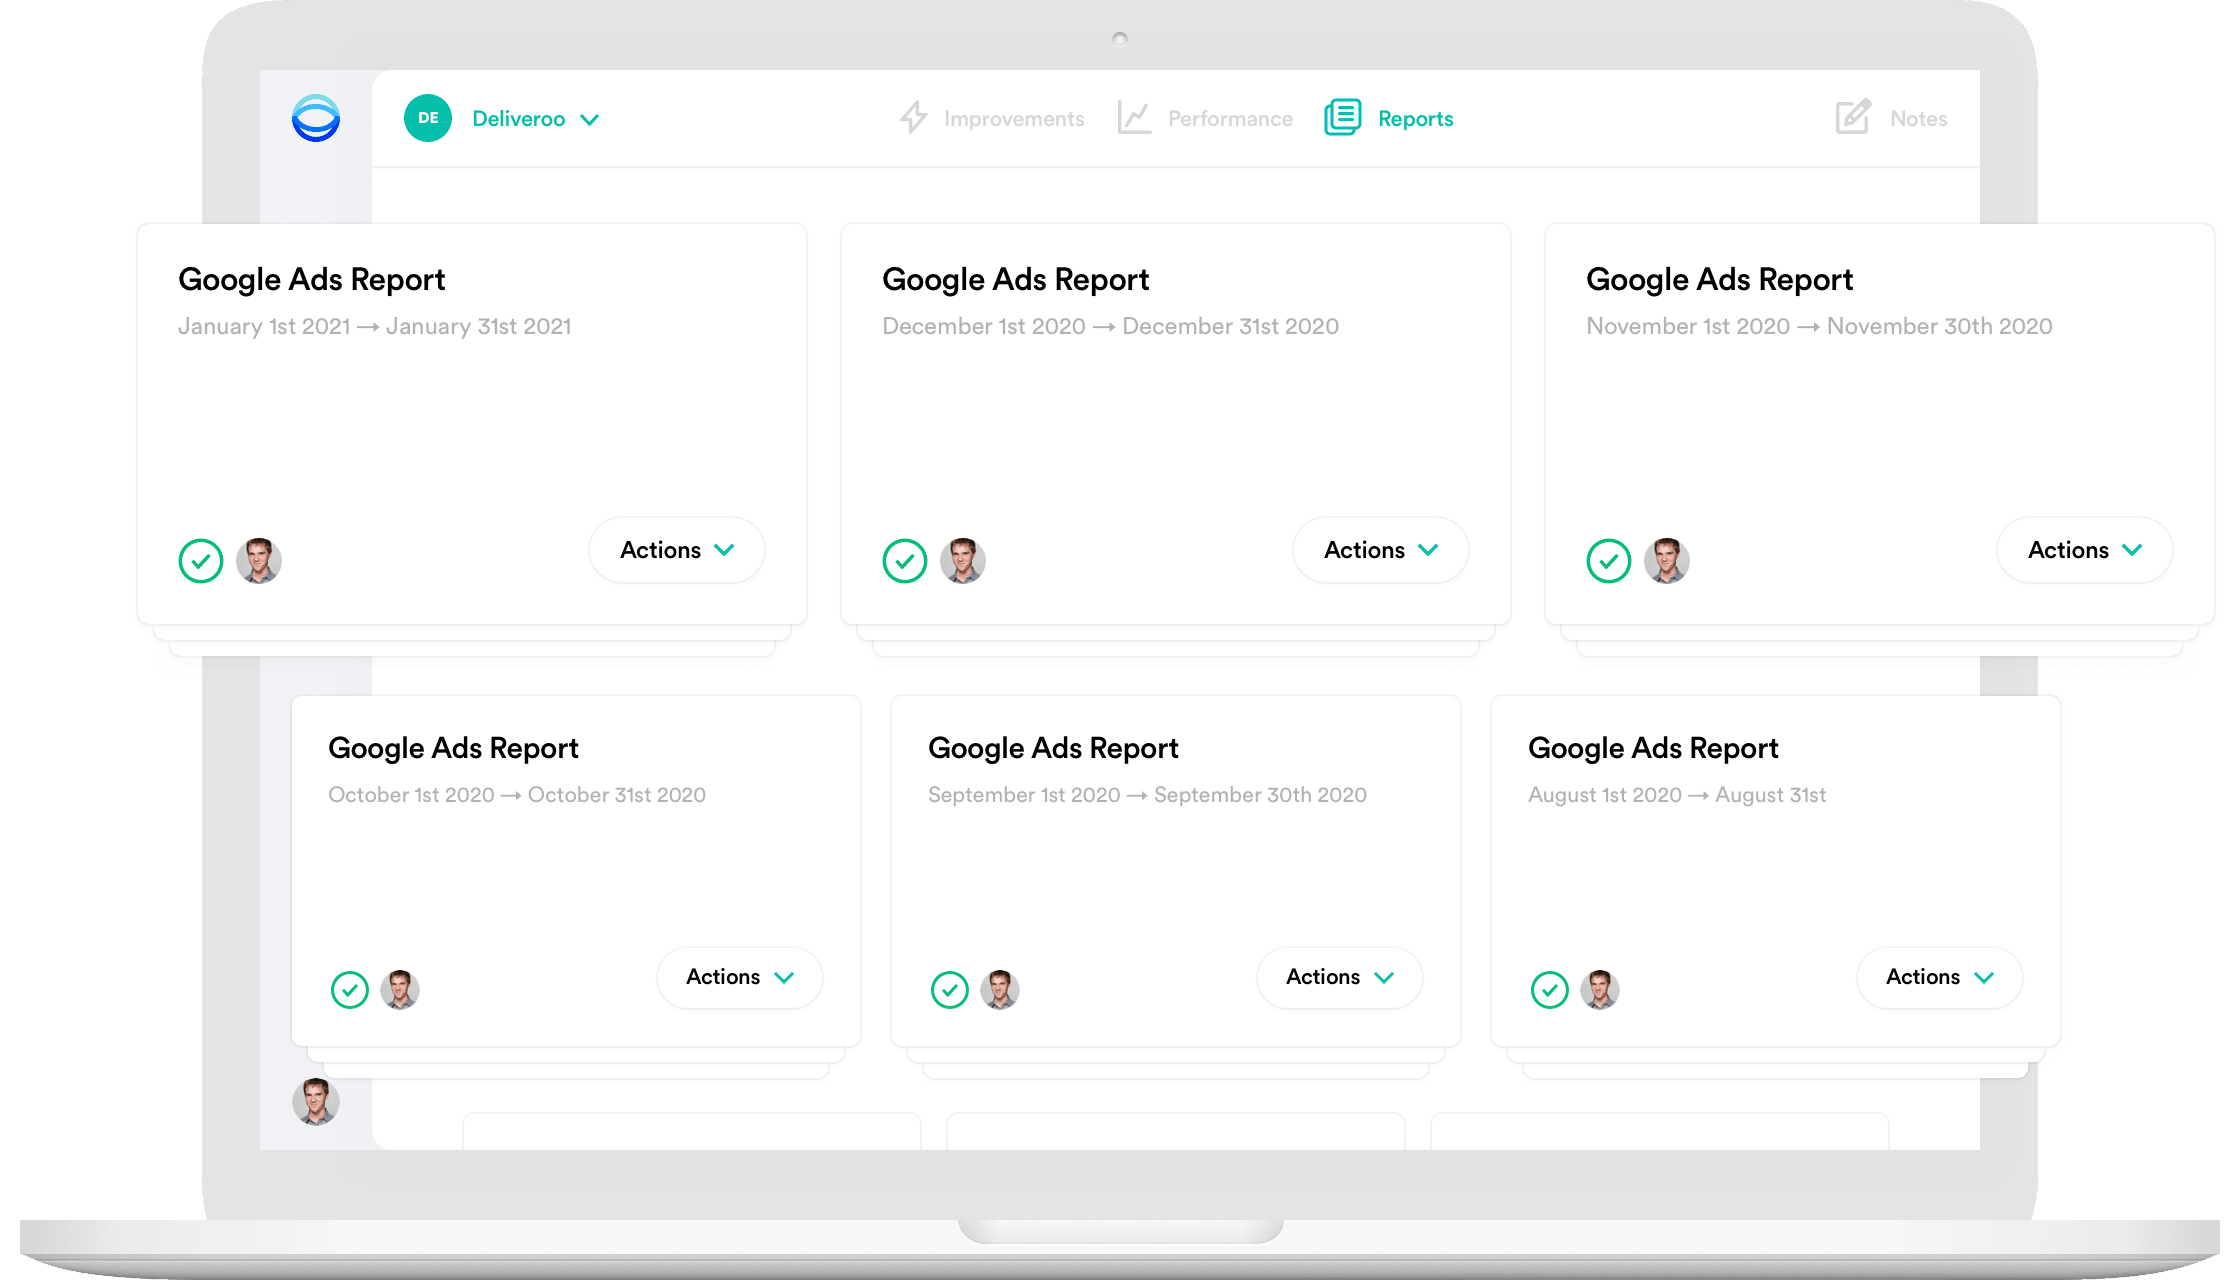
Create templates with your brand and colours. Get auto-generated comments based on your performance data. Export and share with your team, managers, and clients. Use scheduling to automatically generate reports when needed.
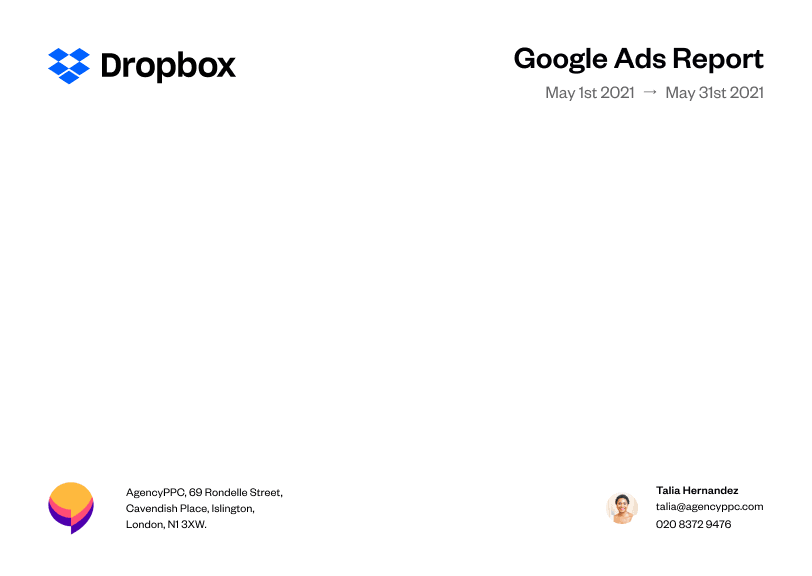
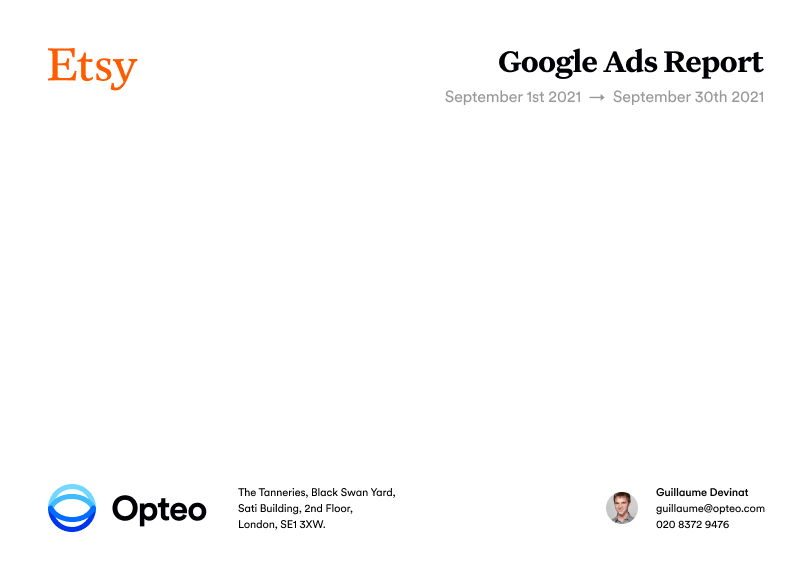
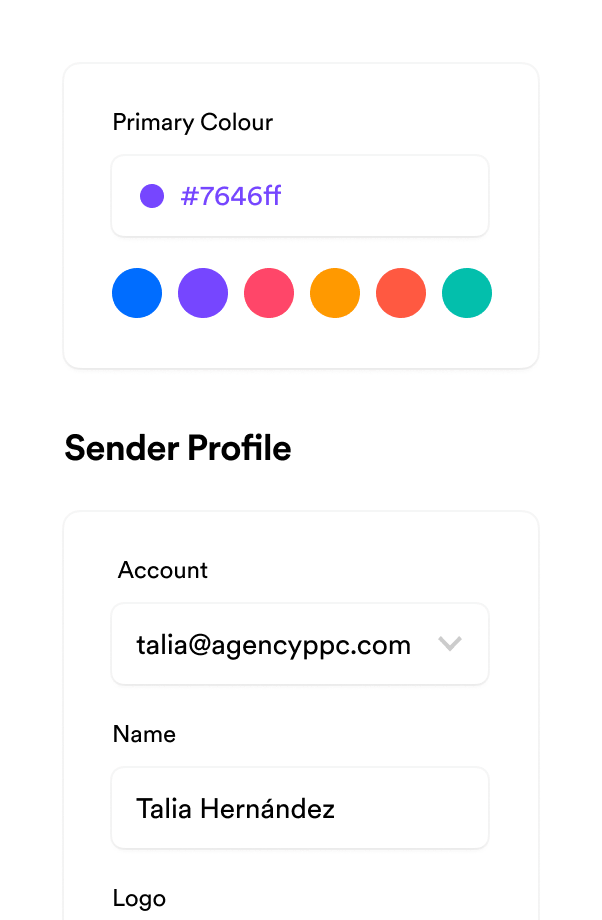
Add your logo, choose a theme, select primary and secondary colours. Create beautiful white-label reports that clients and colleagues love.
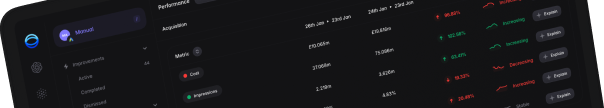
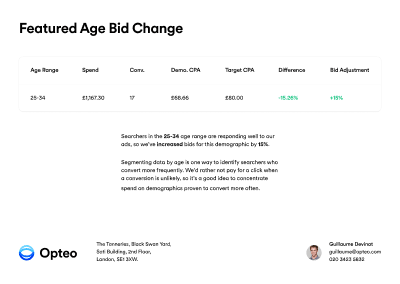
Comments are generated according to the data in your report. Use them as a guide, or replace them with something unique. See Insights and Advice for more inspiration, copy paragraphs into your report at the click of a button.
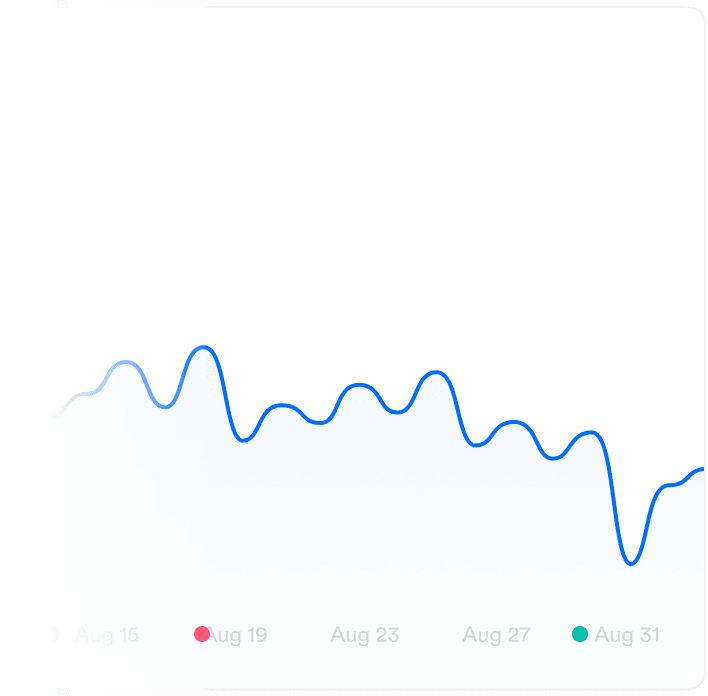
Understand performance in terms of overall website traffic. Show how Google Ads plays an essential role in the digital marketing funnel.
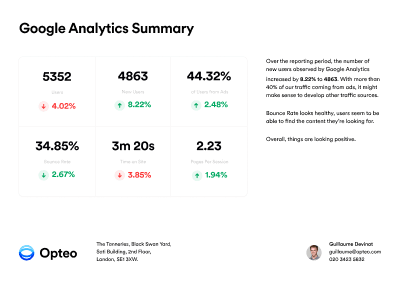
Users
New Users
Of Sessions From Ads
Bounce Rate
Time On Site
Pages Per Session
AgencyPPC, 69 Rondelle Street, Cavendish Place, Islington, London, NW1 3XW.
Relate key metrics to business objectives, help stakeholders frame and understand the value Google Ads can bring to their business.
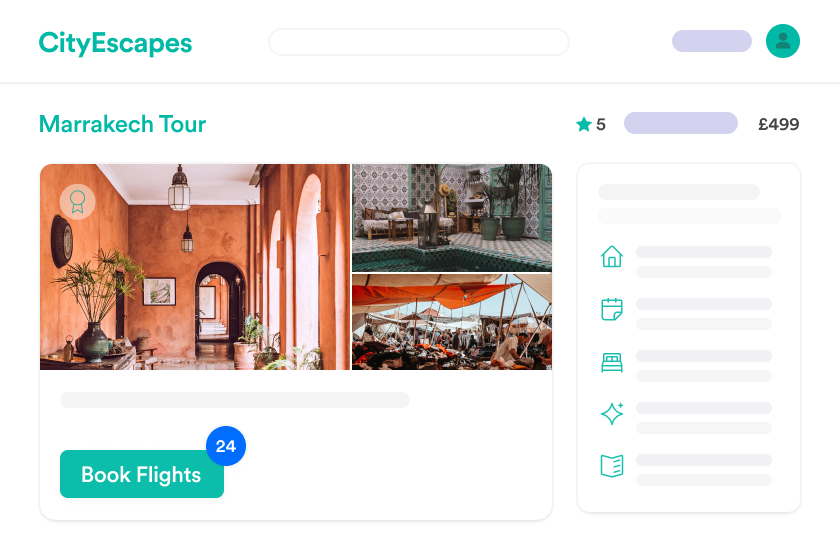
Complicated dashboards can leave people feeling overwhelmed. Help them understand key Google Ads concepts and connect the dots.

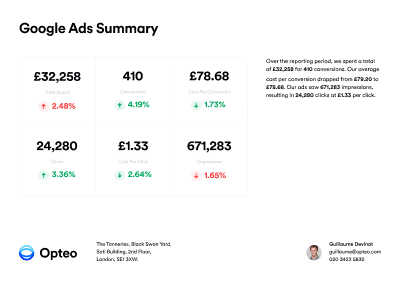
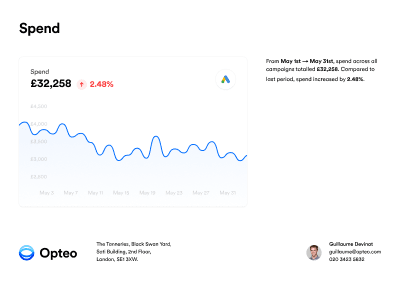
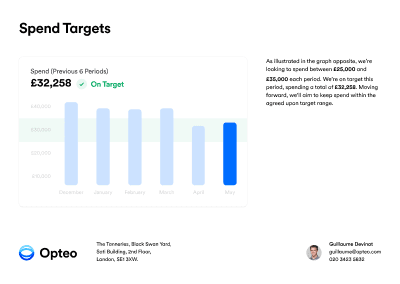
Total Spend
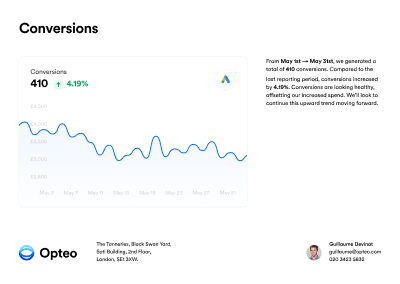
Conversions
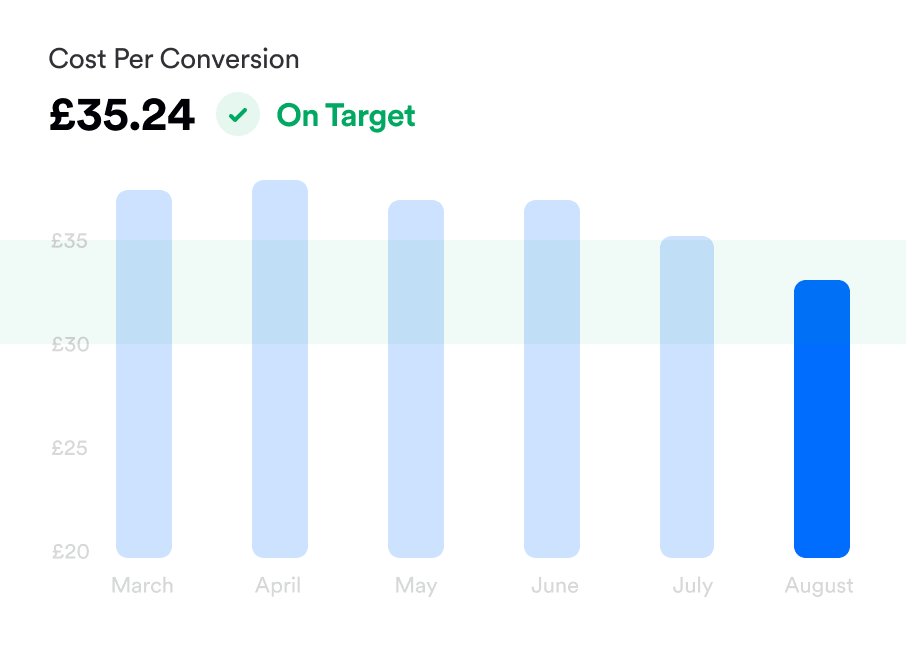
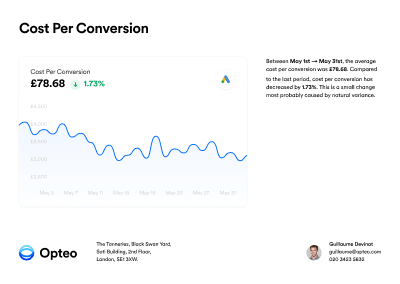
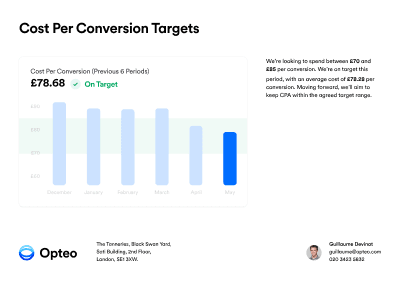
Cost Per Conversion
Clicks
Cost Per Click
Impressions
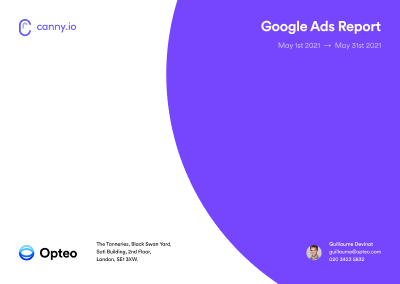
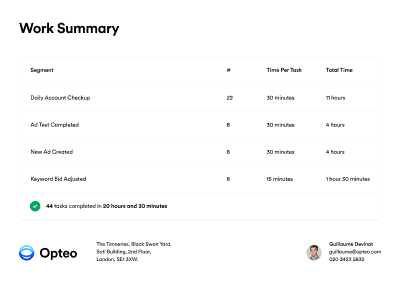
Create beautiful reports that present your work in a friendly and engaging way. Showcase the value Google Ads can bring to a business.


Sharing Google Ads reports with our team has never been easier. Opteo’s templates are well designed and allow us to create beautiful reports on the fly. Our data flows straight in.
João Ricardo Mendes