


View graphs, trends, and behaviour metrics from Google Analytics. Export and share charts with clients and colleagues. Get the tools you need to stay on top of account performance.
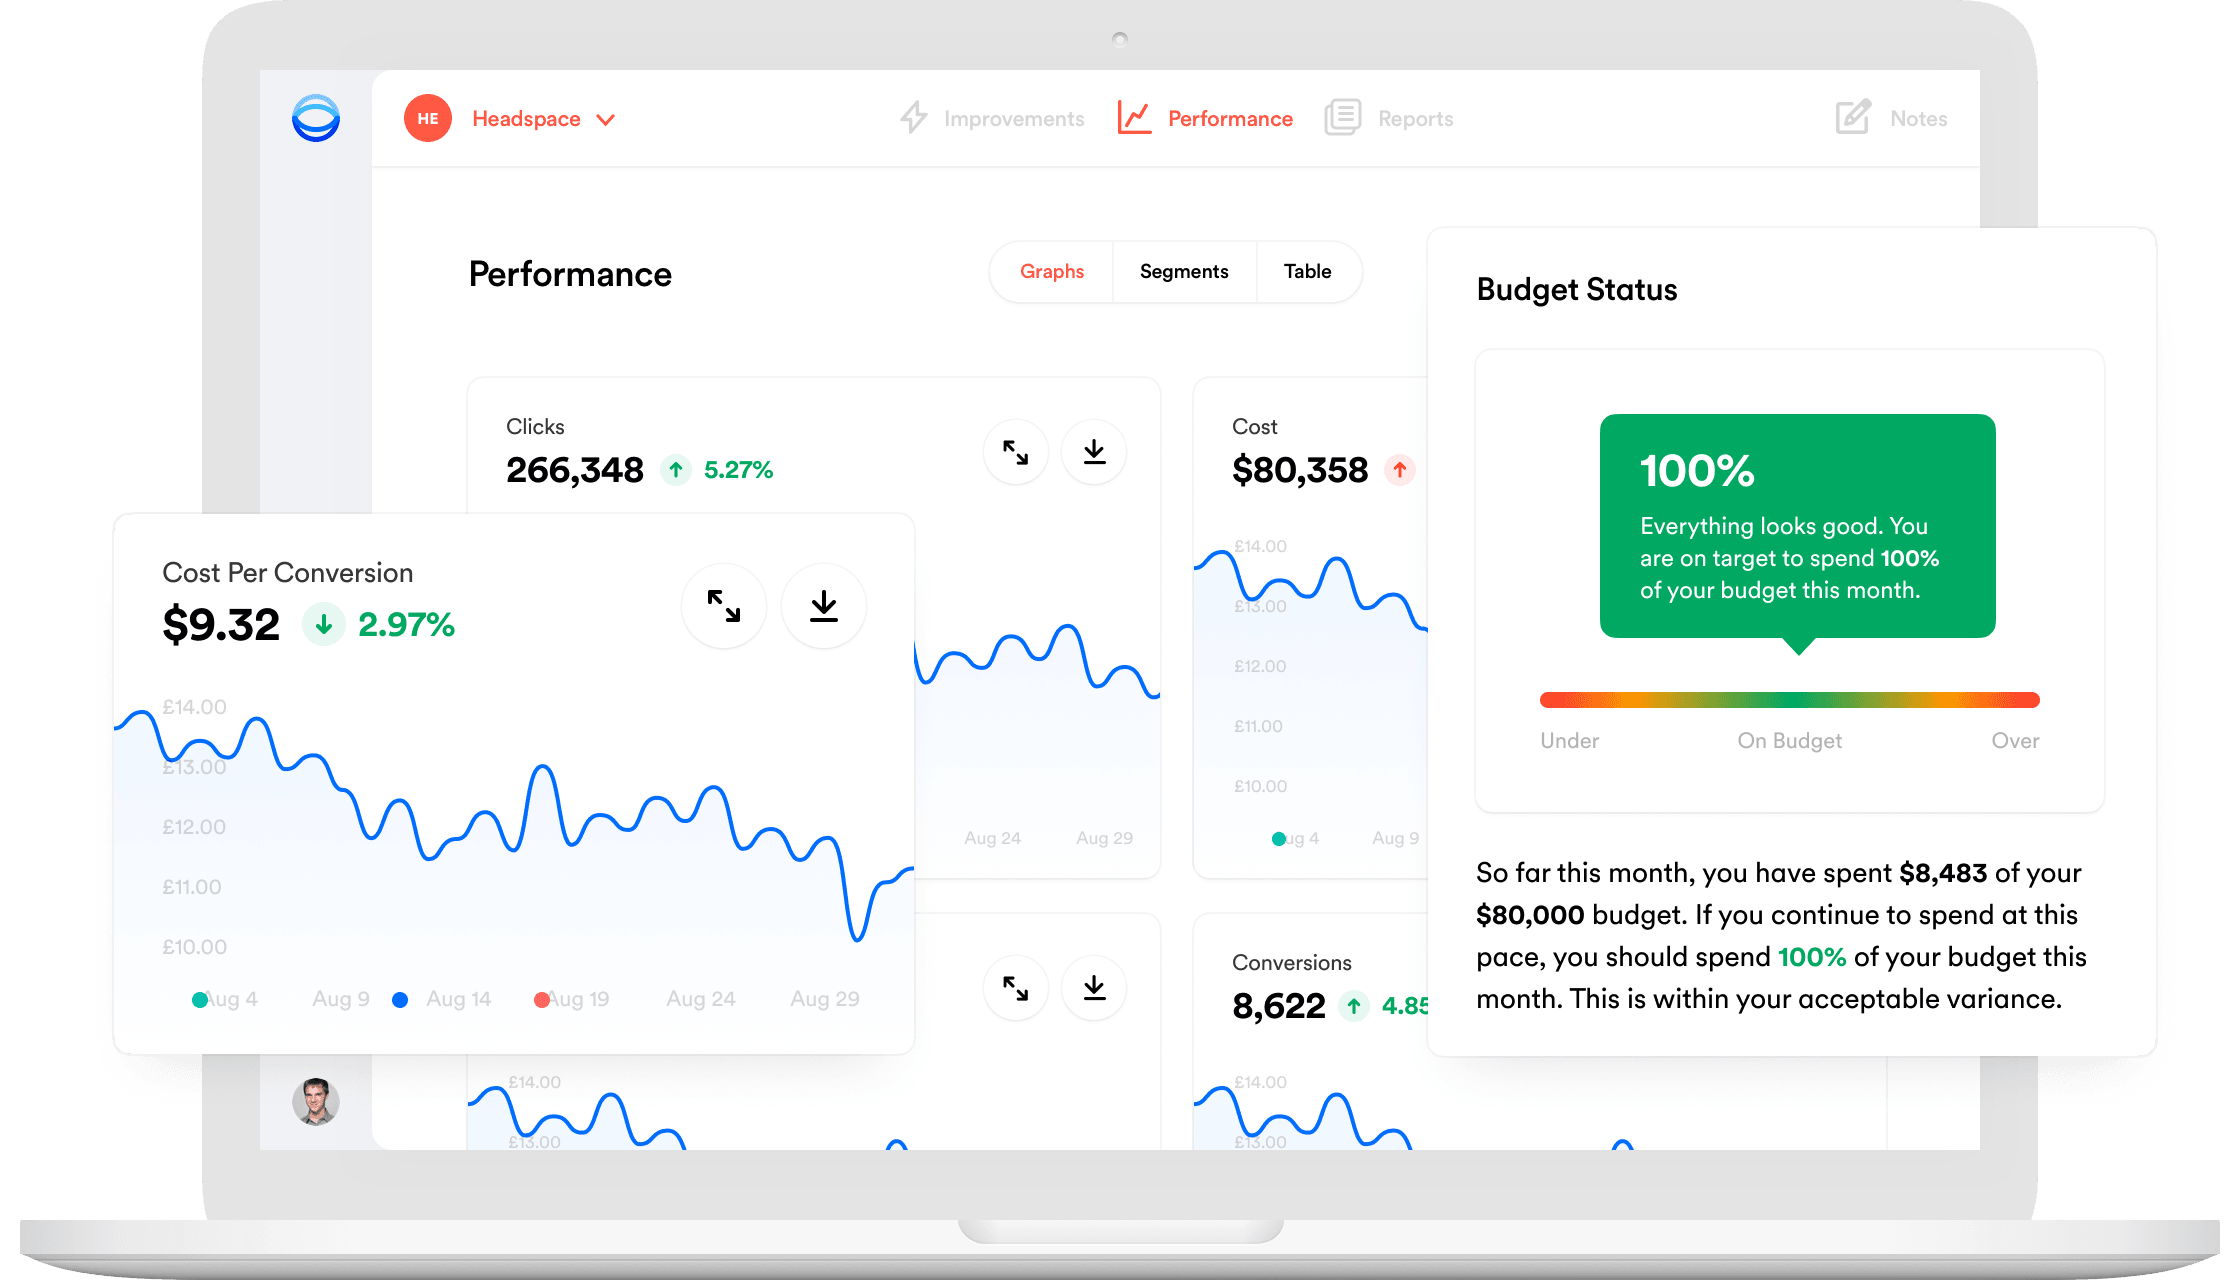
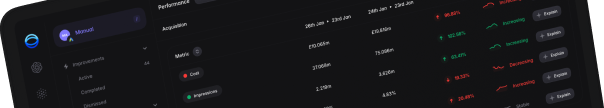
View key metrics alongside recent trend data. See behaviour metrics from Google Analytics. Get access to all the data you need to stay on top of account performance.
Select a date range or use one of our helpful presets. Filter by Campaign and Conversion Type. Manipulate and filter your performance data as quickly and efficiently as possible.
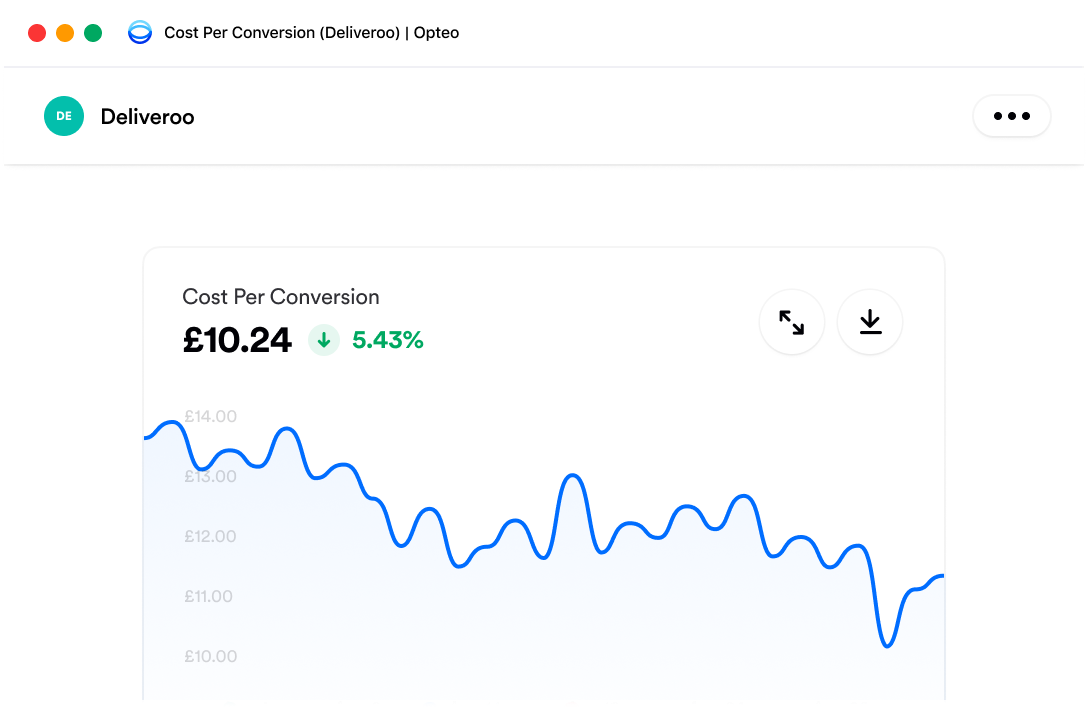
Share performance graphs with a single click. Let clients and colleagues know that things are heading in the right direction, share real-time performance data, keep everyone in the loop.

Whether you’re releasing a new website, starting a new marketing campaign, or signing up to Opteo, add date markers to track events that could cause performance to fluctuate.
New COVID-19 travel restrictions in France
19th August 2020
Opteo is like having an assistant look over our account 24/7. Not only does it provide detailed performance breakdowns, it helps us better understand our accounts at a glance.
Sarah Hum