Basic Principles
Last updated November 2nd 2023
In this section we cover some of the principles that form the base of our understanding of Google Ads concepts.
#ToFu, MoFu and BoFu
The marketing funnel is a conceptual framework that illustrates the customer's journey from a starting point of not being aware of a product or service, through the stages of researching and evaluating solutions on the market, to the final stage of making a purchase.
The funnel analogy illustrates how there are a bigger group of people to reach in the earlier stages of the purchasing journey, this is the wide end of the funnel, known as top of funnel, or ToFu. These are users who are not yet aware of a product or service
In the middle stage of the funnel, or MoFu, we find users who are actively researching products and services, and considering making a purchase. This group is smaller than the ToFu group, but more likely to convert, as they are already showing an active interest in and knowledge of a product or service.
The smallest area of the funnel is the bottom, BoFu. People in this segment are actively looking to make a purchase, targeting traffic from this segment is therefor the most likely to result in immediate conversions.
If we layer in the temperature analogy, traffic at the top of the funnel is colder, and warms up the further down the funnel you get. Your marketing strategy as a whole should cover the full funnel.
Making sure you have a presence with users in the ToFu and MoFu segments is a way to ‘warm up traffic’ and secure a steady supply of users in the BoFu segments.
Knowing what your typical customer journey looks like is an important piece for knowing how to target users in the different parts of the funnel. If you know what their next step on the purchasing journey is, you can meet them there with a relevant message and nudge them in the direction towards conversion.
#Campaign Groups
As a Google Ads account scales, it often becomes necessary to fracture the account into an increasing number of campaigns. More segmentation allows for better control over budget for the different business areas, if ie. you divide geographical targeting out unto separate campaigns you can chose how much budget goes to each location.
More campaigns can, however, make it more difficult to get a quick overview of the account. To make this analysis easier, it’s often helpful to group the performance of similar campaigns together - especially when there are many campaigns.
This grouping makes it easier to conceive and implement a strategy — for example, it’s easier to reason about where to allocate your budget across 4 groups of campaigns instead of across 30 campaigns.
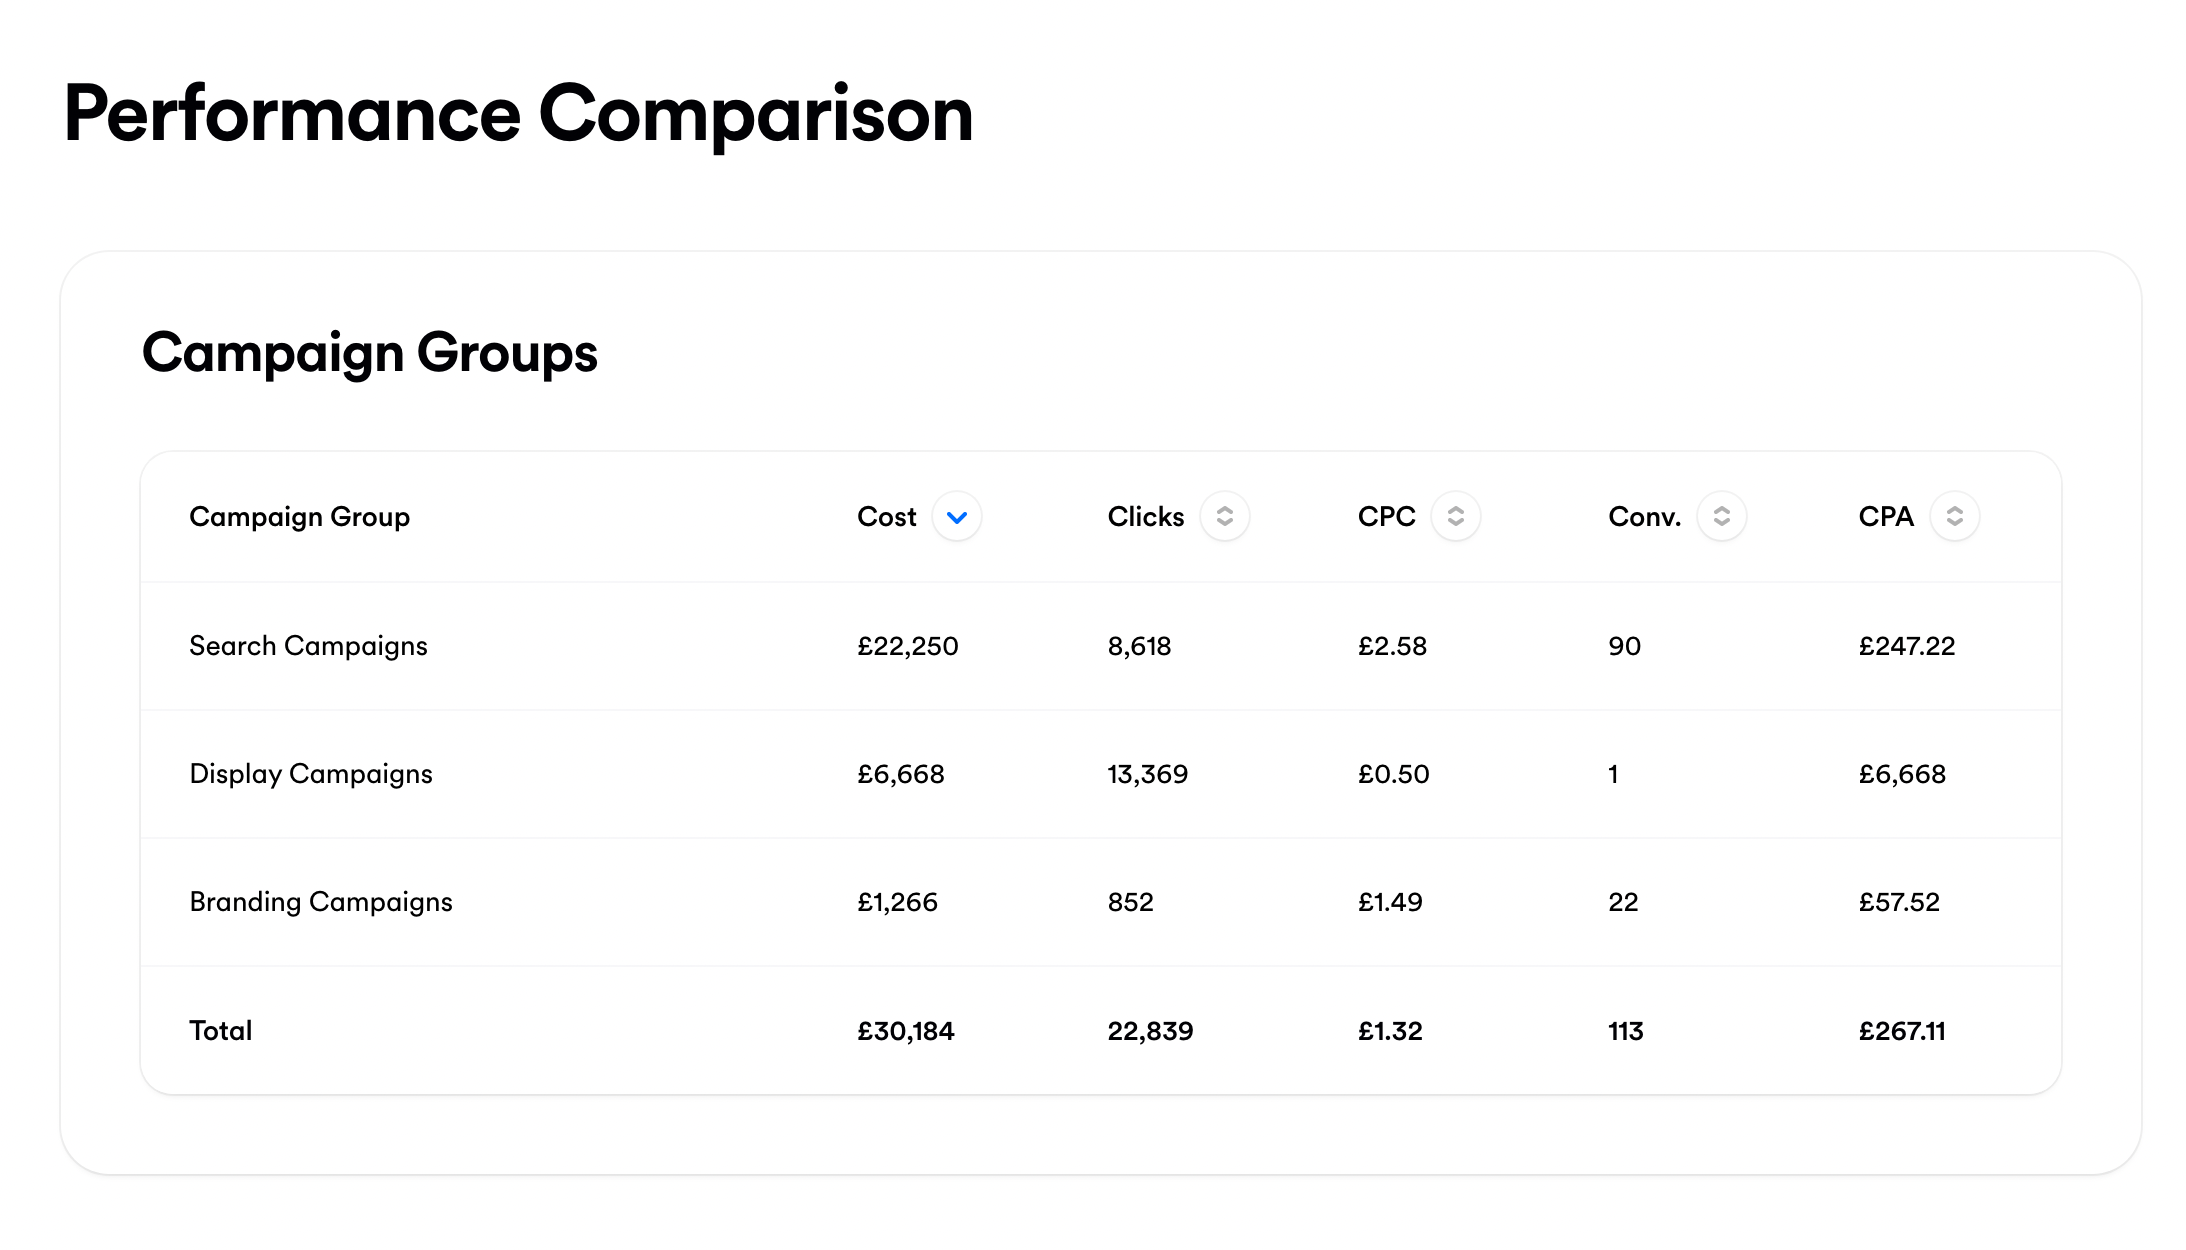 A campaign group performance comparison in Opteo
Aggregating performance data also allows you to reach more statistical significance when making optimisation decisions. For example, if you’re trying to evaluate the performance of search partners and whether you should keep investing in them, you might not have enough data to make that decision on a per campaign basis.
But grouping data together could give you the necessary volume to take action with confidence. This is especially relevant for high CPC industries. For example, it’s not uncommon for lawyer related keywords to reach upwards of $20 a click, making it harder to reach statistical significance on individual campaigns.
Grouping campaigns together also determines a peer group for an entity (by entity we mean a keyword, an ad group, an audience, a segment) — this makes for better ground for comparing performance of single entities across an account.
#Guidelines to group Campaigns together
A single, account wide measure of CPA or ROAS can be helpful to track general trends, but won’t be very helpful to guide optimisation decisions. In practice, splitting the account into campaign groups and using campaign group averages, is much more helpful. There are a few core dimensions to consider when grouping campaigns together.
In the same advertising channel
As a general rule, it makes sense to separate campaigns in different advertising channel types (search, display, shopping, video etc). These campaign types are just too different from one another, typically operate at different stages of the marketing funnel, and performance (eg. CPA or ROAS) averages stop making much sense when you blend them.
In the same stage of the marketing funnel
Even if campaigns are in the same advertising channel, sometimes they are targeting very different stages of the marketing funnel. For example, one display campaign might be used to generate awareness at the top of the funnel, while a different display campaign targets remarketing audiences at the bottom of the funnel.
In the same way there are many different types of search campaigns — brand, generic, and competitor campaigns all occupy different areas of the marketing funnel. You wouldn’t want to mix the performance data of brand and generic campaigns.
You’re working on the Google Ads account for Minor Figures, a trendy oat milk retailer based out of London. The account has branded search campaigns to show ads when someone searches for their brand terms like “minor figures”, “minorfigures”, and “minor figures barista oat”.
The average quality score for keywords in this campaign is typically 10/10, making the CPC very low. The conversion rate is high, given that these are brand aware searchers. The average ROAS for brand campaigns is 900%.
They have other generic campaigns targeting keywords like “organic oat milk” and “milk alternative” where the average ROAS is 150%.
Considering these campaigns as comparable would be a mistake. For example, shutting down the generic campaigns because they are performing much less well than the brand campaigns would not be a wise decision.
These campaigns simply occupy different spots in the marketing funnel and should not be compared — in this case the generic campaigns are at the top of the funnel, generating awareness, and playing a part in feeding the the bottom of funnel brand campaigns.
Similar performance Expectations
Campaigns with significant differences in performance targets should be placed in separate groups, this also means a campaign should be grouped with other campaigns who optimise towards the same conversion actions.
If for example if you had a campaign with a Custom Goal of inquiry form submits and another campaign optimising towards e-commerce checkouts, it would not make sense to combine the performance data of these two campaigns.
An online retailer in the coffee industry has a campaign targeting high end espresso machines which retail for $5,000 and up. They also sell their own coffee beans and have a separate campaign for those.
As you might imagine, the metrics of these two campaigns will be very different. They could almost be considered as two separate business units of this advertiser. Grouping performance data wouldn’t make sense as drastically different performance is expected.
#Statistical significance and minimum clicks
It’s important to gather enough data before evaluating performance. But it’s not always clear what “enough data” means.
A common approach is to use a minimum number of conversions. For example only looking at keywords which have at least, say, 3 conversions, as it's considered their CPA otherwise isn’t meaningful. In practice this approach however proves to be problematic.
Imagine we just launched a keyword and it got very lucky — it generated 3 conversions off of 10 clicks at £1 each. Is it really fair to say that this keyword has a CPA of £3.33 and that we should increase its bid? Or conversely, imagine a keyword spent a large amount of budget and got 1 conversion, shouldn't we do something?
A more sensible approach is to ask the question "on average, how many clicks does it take to get to 3 conversions?"
We can express this question with the following formula: Minimum clicks = (1 / Average conversion rate) * 3.
For example, if a campaign group has a conversion rate of 10%, then it takes 30 clicks to get 3 conversions — 1 / 0.1 * 3. 30 clicks is a better minimum than 3 conversions. So in our theoretical case above where we got 3 conversions with 10 clicks, this new campaign wouldn't pass the minimum clicks test, we would only evaluate its performance after 30 clicks.
#Lookback windows
A lookback window is the date range for which you’re viewing performance data. A way to get more data is to select a longer date range like the last 90 days instead of the last 7 days. But a smaller look back window means “fresher” data which tends to be more relevant to the immediate future.
In practice, a huge account could have more than enough data in the last 7 days, and a very small account might need 90 days of data to have a reasonable volume to make a decision.
Generally, we want the shortest lookback window above the minimum clicks of that entity's environment. We want a date range, which simultaneously gives us the freshest data (ie. the shortest, most recent time range), but also one which provides enough data to make an informed decision (ie. above minimum clicks).
#Considering the last change
Imagine that today, you looked at the performance of a keyword over the last 30 days, determined that this keyword was doing very well, and you doubled the bid from $1 to $2. Now imagine that 10 days have passed, and you’re looking at the performance of this keyword over the last 30 days in order to adjust the bid again.
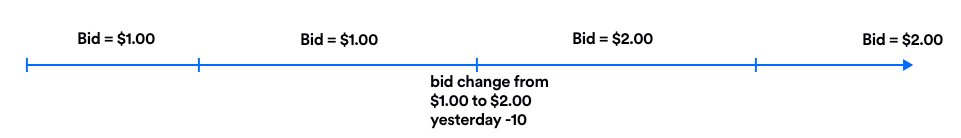 Timeline illustrating a bid change 10 days ago
Looking at the last 30 days of data would be a mistake because you’d be looking at 20 days of data where the bid was set to $1, and 10 days of data where the bid was set to $2.
Take notes of the changes you make
When looking at the performance of an entity, you should select a lookback window that starts after the last change you made. So if a change was made to an entity 17 days ago, it would be ok to look at data over the last 7 days, 14 days, but not 30 days. This is why it’s handy to take notes of the changes you make!
#Incremental Performance
It's important to note that Google Ads traffic is what’s known as price inelastic. In other words, when you increase your CPC bid (or loosen your CPA/ROAS target), your additional costs grow disproportionately faster than your additional clicks — you encounter diminishing returns.
We've proven this by compiling data from the bid simulation report of 10 million keywords across tens of thousands of accounts. Here's what the average curve looks like:
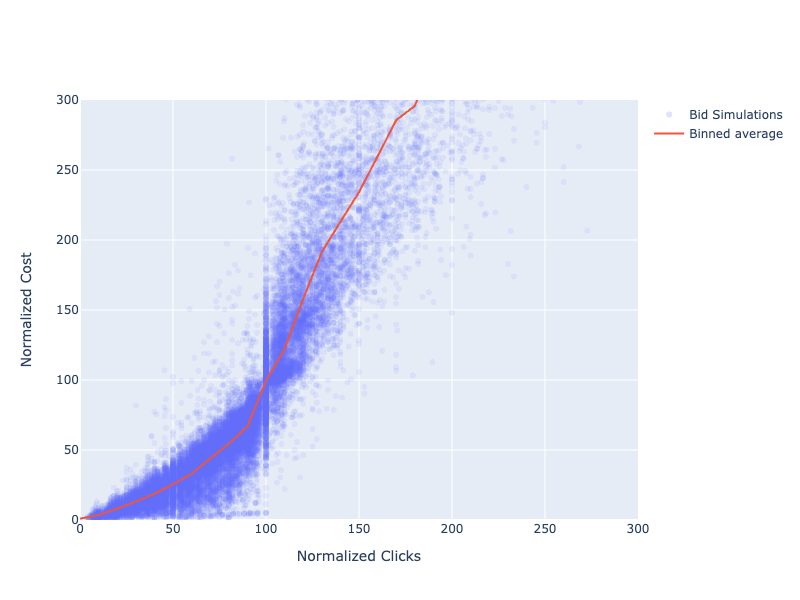 This graph shows clicks vs. cost from Google’s bid simulations. This data is normalised meaning that all keywords have a current cost of 100(%) and a current clicks of 100(%).
 As you can see incremental cost tends to outpace incremental clicks. For example, in order to increase clicks by 20% (from 100% to 120% in normalised clicks) costs increase by ~50% (from 100% to 150%).
The trend of this relationship illustrates how you often end up paying significantly more for your extra conversions, when increasing budget. If we look at the increase in average CPC/CPA or decrease of ROAS, the drop in performance might not look so drastic - but often we will see very expensive clicks or conversions hiding within than average.
If, for example, you bid $1, and get 100 clicks for $100, your CPC is $1.00. But if you increase the bid to $1.20, you might get 110 clicks for $125, increasing CPC to $1.14. This 14% increase in CPC doesn’t seem that significant. But consider that the 10 additional clicks costed $25, or $2.50 each! In other words the incremental CPC is $2.50.
Here’s a table to summarise this example:
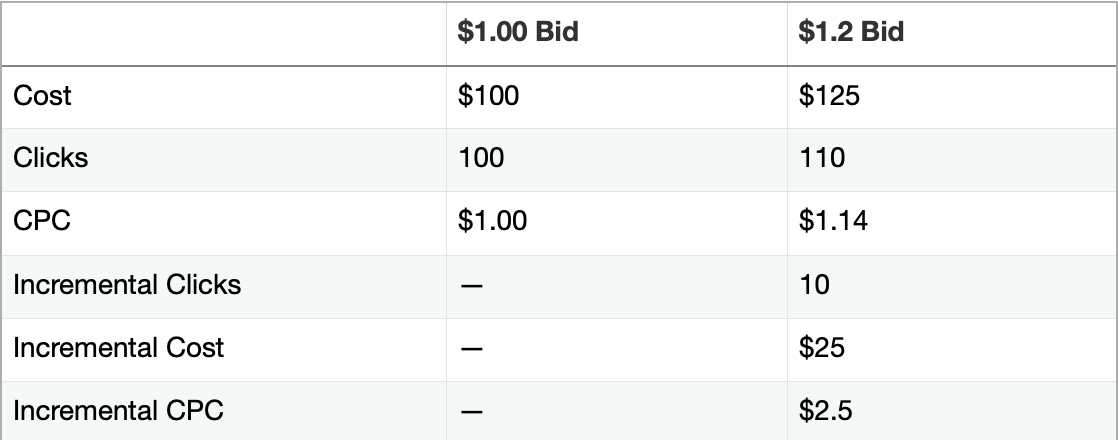 incremental clicks cost 2.5x more than the average CPC!
Further Reading
"Hidden Costs in your Bid Strategy: Incremental Measurement" - This article does a good job of illustrating incremental measurement